


Data Mining
Data mining is the process of discovering new patterns from large data sets involving methods at the intersection of artificial intelligence, machine learning, statistics and database systems.The objective of data mining is to extract knowledge from a data set in a human-understandable structure and involves database and data management, data preprocessing, model and inference considerations, interestingness metrics, complexity considerations, post-processing of found structure, visualization and online updating
MSSQL SSAS Data Mining Solution
The Analysis Services includes an intuitive Data Mining Designer for creating and viewing data mining models provides cross-validation lift charts and profit charts to compare and contrast the quality of models visually and through statistical scores of error and accuracy.The Microsoft SQL implementation encompasses algorithms such as Decision Trees Clusters Association Time and Naive Bayes Neural Networks
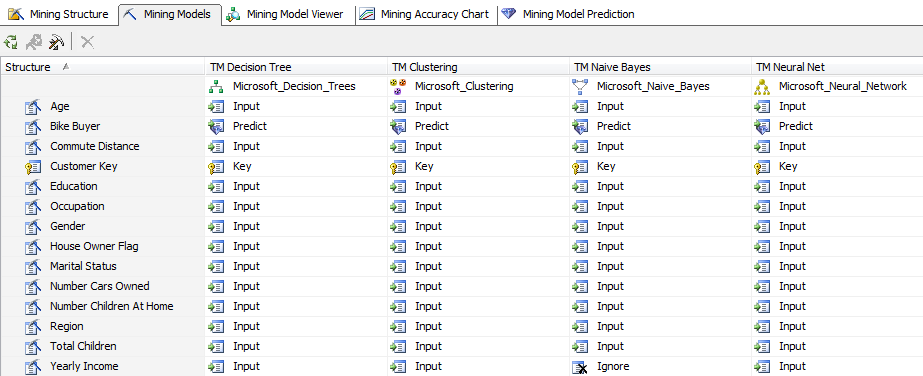
Mining Designer
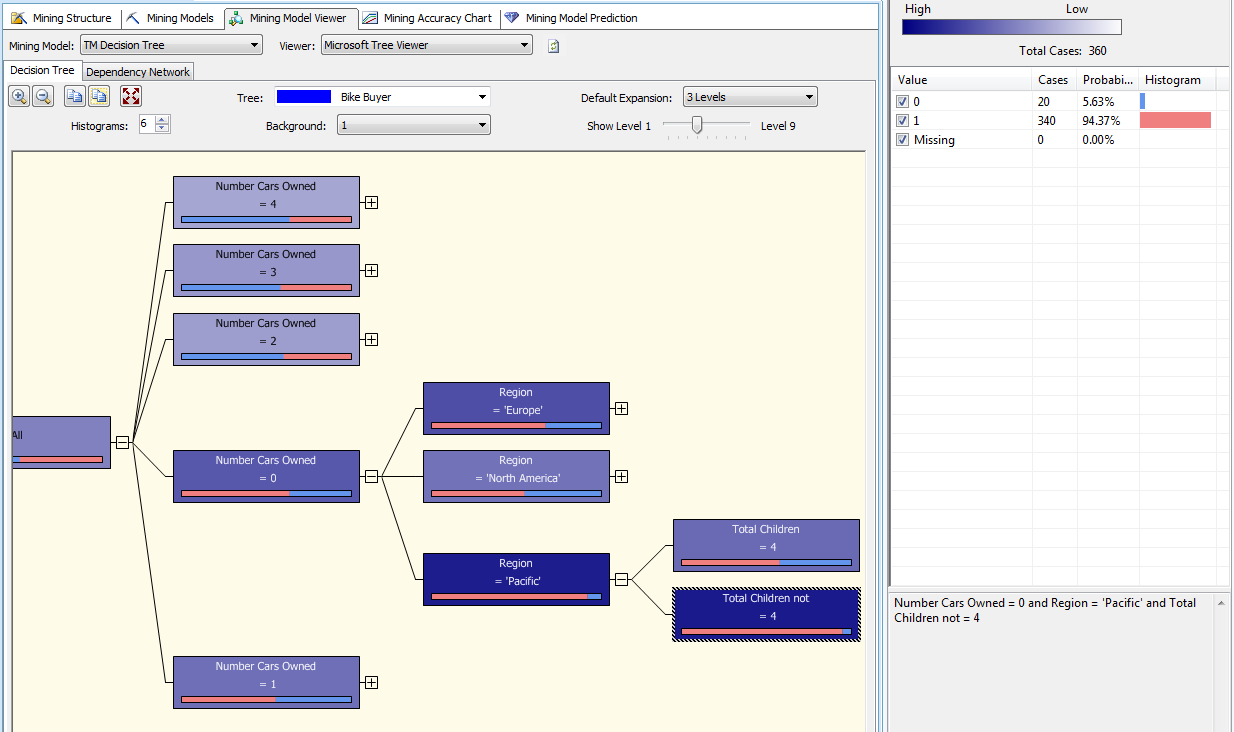
Mining Viewer
Allows you explore the patterns and rules learned by the mining algorithm from the training data.This is an example of the visualization of a Decision Trees algorithm .Through the Viewer we can see there's 94.37% Probability that those most likely to buy a Bike are from the Pacific with no cars with less than 4 kids
MSSQL Excel Data Mining Add-On
Enables you to go through the entire lifecycle of a data mining project, including preparing data, building, evaluating and managing mining models, and predicting results using either spreadsheet data or external data accessible through your Analysis Services database.
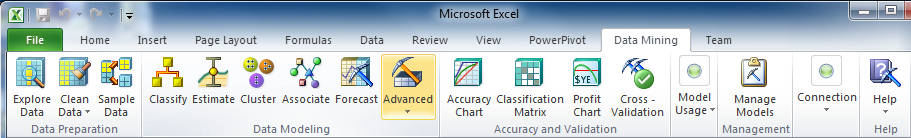
Data Preparation
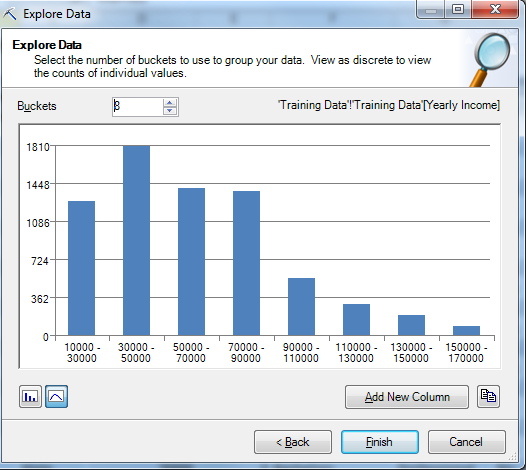
Explore Data:Visually plots the distribution of discrete and continuous values and possibly add groupings back to the source data
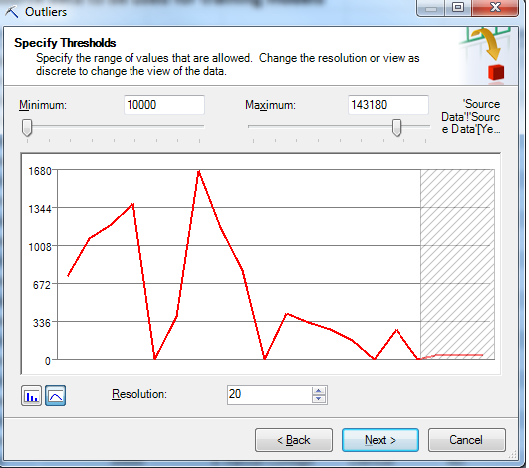
Clean Data:Remove outliers re-label Discrete state values and specify range of values allowed
Accuracy and Validation
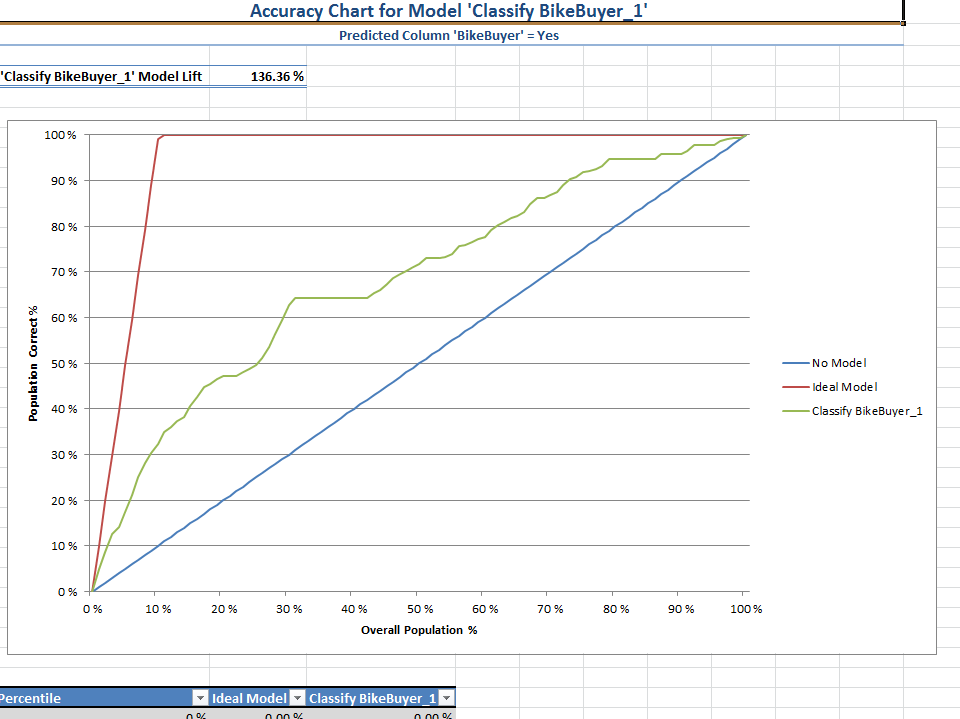
Accuracy Chart:Evaluates the performance of your model against test data by drawing a lift chart for classification models and a scatter plot for estimation models
Data Modelling
Excel Data Mining provides wizards that help you easily build common types of mining models without worrying about the actual mining algorithms and associated parameters supported on the server Here’s a page from the Associate wizard that helps you build a model to find associations in transactional data
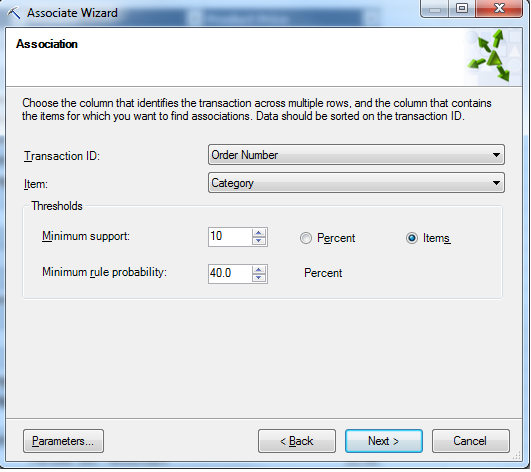
Results of running the Associaion Wizard showing the Association e.g between Products and great at Marketing Products for example there is a probability that 79% of those who bought Vests and Mountain Bikes are likely to buy Fenders
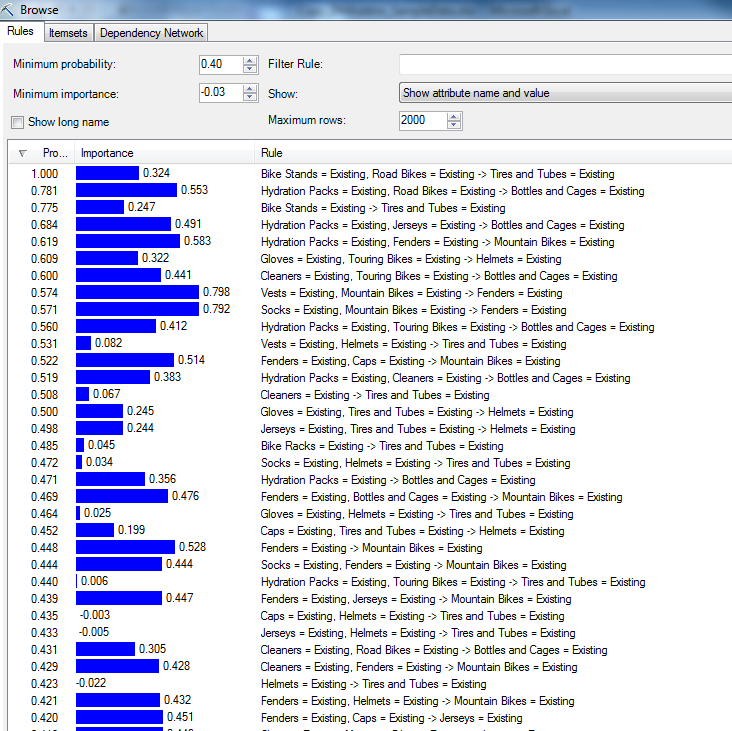
Table Analysis Tools For Excel
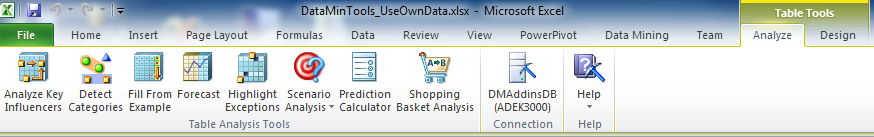
Table Analysis Tools for Excel:Allows you to analyze your spreadsheet data in powerful ways with just a few mouse clicks by employing SQL Server Data Mining behind the scenes
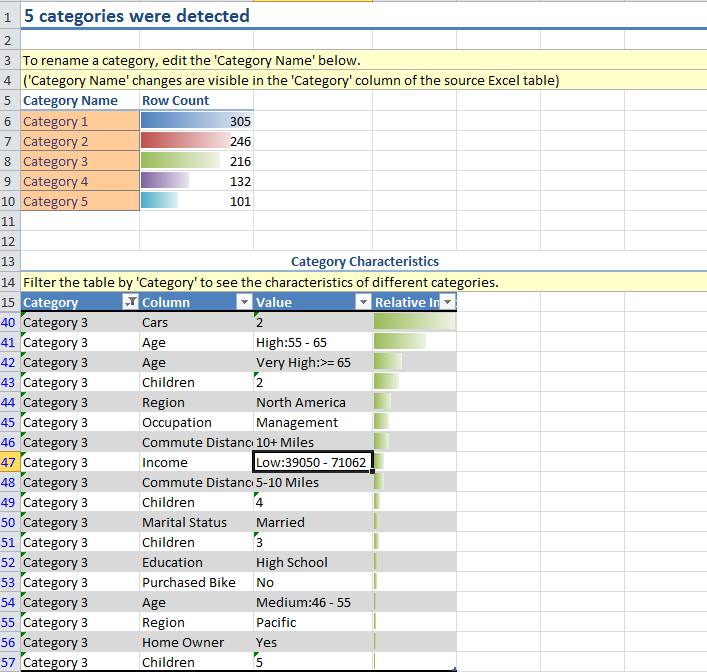
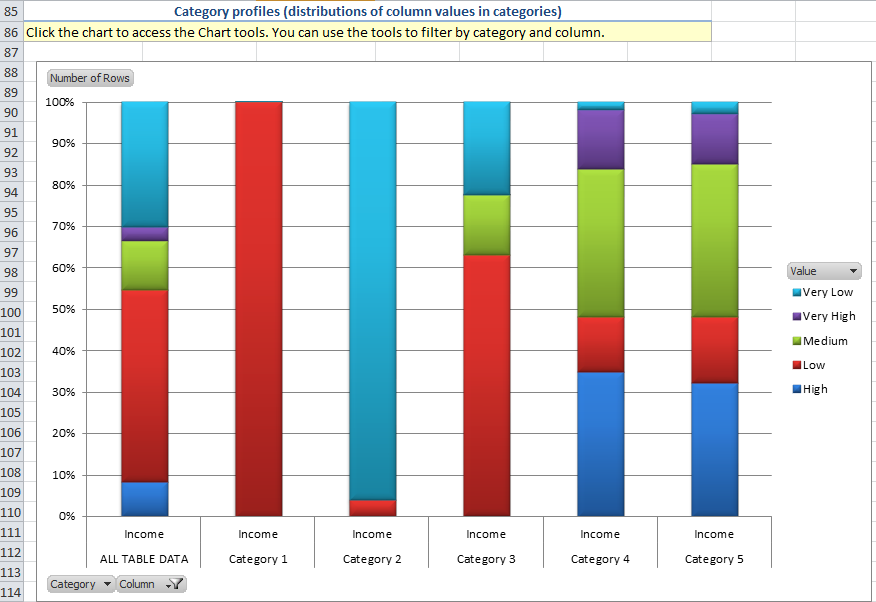
Detect Categories
Detect Categories tool detects the rows in the data table that contain similar characteristics and groups them into categories.Each category identified is described by the distinguishing characteristics of the rows assigned to the category. Based on those characteristics, you may choose to give the category a more understandable name
Forecast
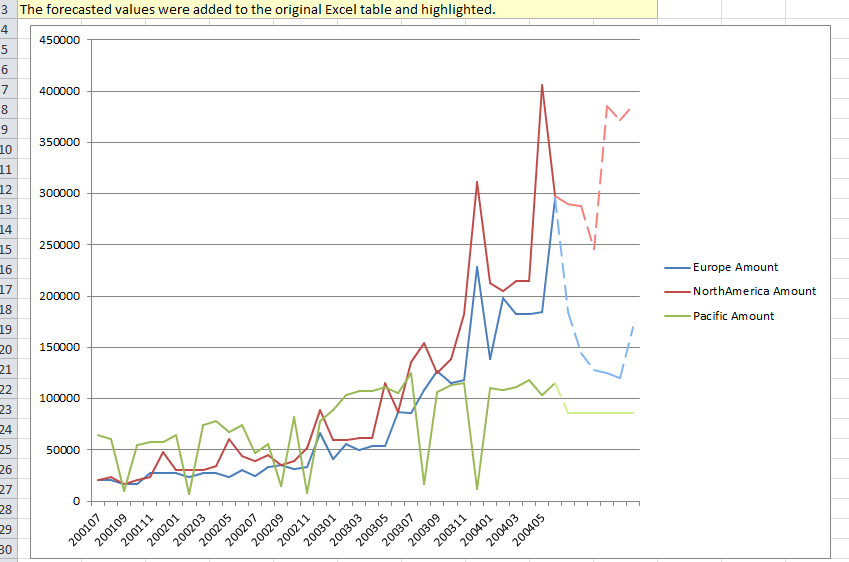
Forecast tool predicts future values based on trends in existing time series data. For example, you can forecast what annual sales will be two years from now, based on current conditions and factors in your data. The tool appends the forecast values as new rows to the table selected for forecasting.The tool also produces a chart that graphically plots the existing and forecast values as shown below
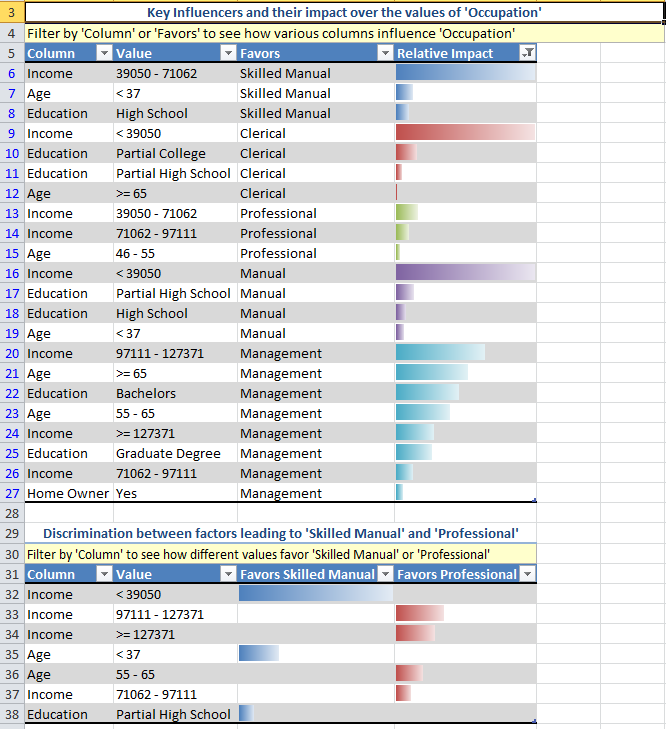
Analyze Key Influencers
Analyze Key Influencers Tool analyzes the patterns in data that have the strongest influence on a certain outcome.For example, if you have a list of sales for all customers, Analyze Key Influencers can analyze the factors that are key to determining which customers will spend the most money. It may not be obvious which fields are the key influencers.For example, a field representing annual income may not be the biggest factor for customers who spend the most money. It could be other factors, such as number of children in the household, geographic location, or a combination of these fields.In this example we can see the determining factors that influence certain Occupations
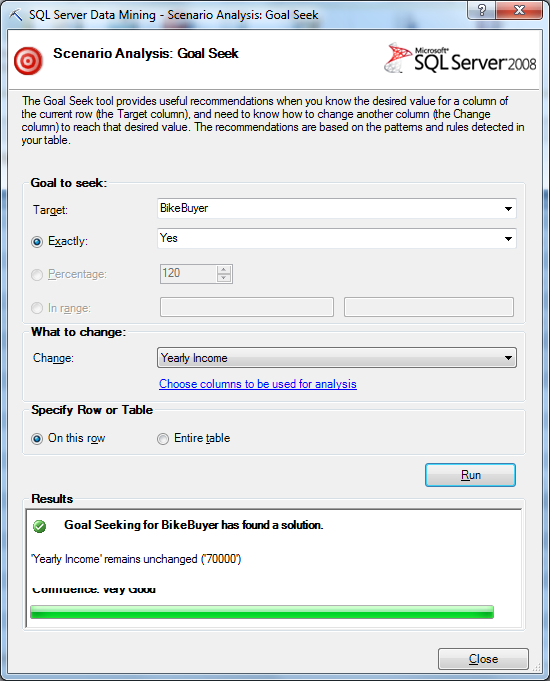
Scenario Analysis
Goal Seek:Analyzes and reports the factors that need to change to achieve a specific goal. For example, if a company wants to grow from ten million dollars to fifty million dollars, this tool can help to determine how to reach this goal, based on factors that it analyzes in your data. The sample output below shows the output produced by the tool for a single row in the sample data
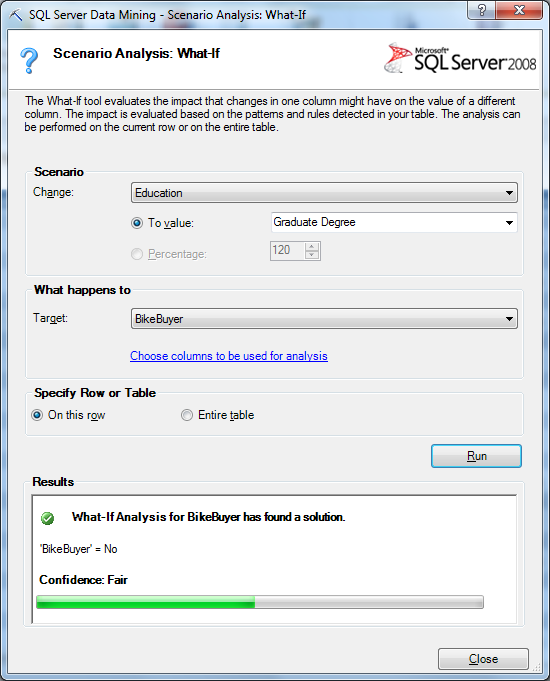
What-If:Analyzes and reports the impact of a proposed or hypothetical change. For example, you can see the effect of change in sales for your target customers if the price of a product increases. With “what-if” scenarios, you can determine, for example, that increasing price does not achieve the results you need, but increasing the warranty period might. The sample output below shows the output produced by the tool for a single row in the sample data
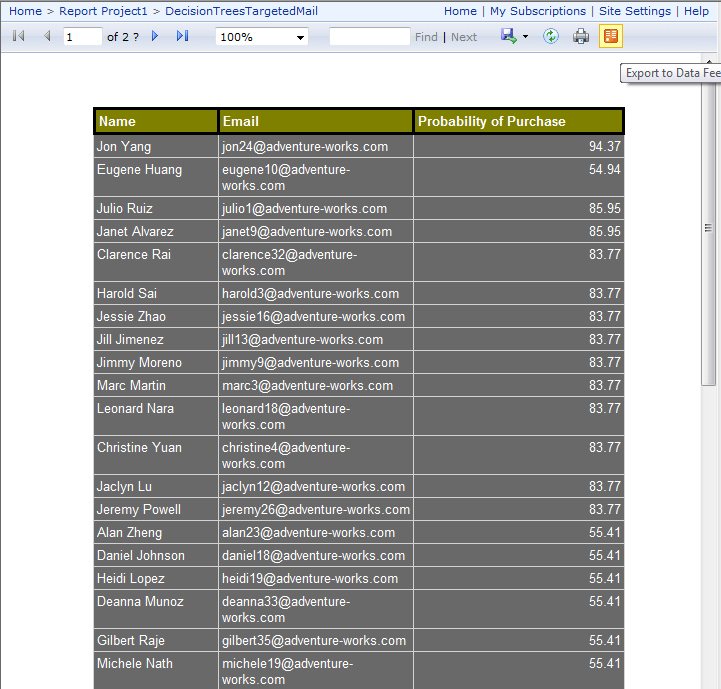
Native SSRS Report Integration
SQL Server Reporting Services can render reports directly from a data mining model by using a data mining extensions (DMX) query Furthermore allows users query directly against the data mining structure and include attributes beyond the scope of the mining model requirements presenting complete and meaningful information.Below is DMX Query Editor Pane for Reporting Services
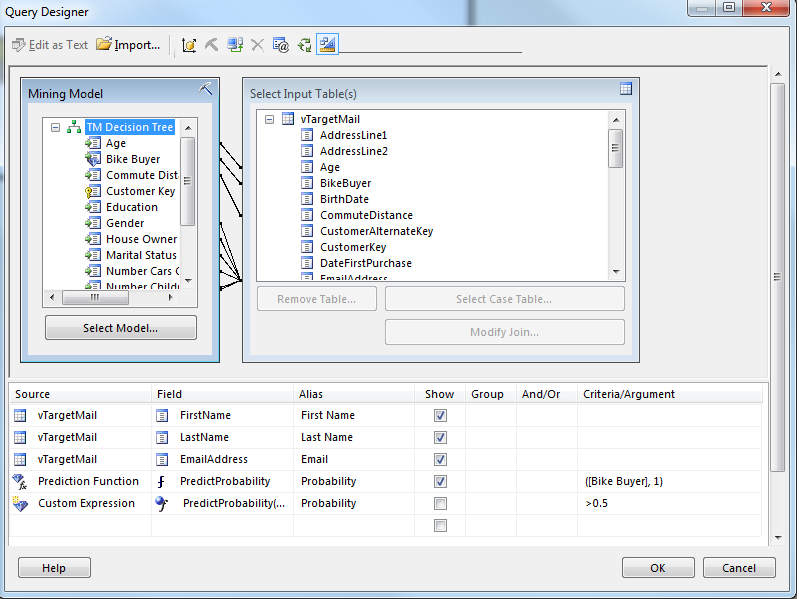
SQL Server Reporting Services provides the ability to generate parameter-driven reports based on predictive probability. For example the query shown in Diagram above analyzes a list of prospective customers and uses a data mining model to assess the probability of those customers buying a bicycle. The query is filtered to return only prospects in Report generated using SSRS below